Chart
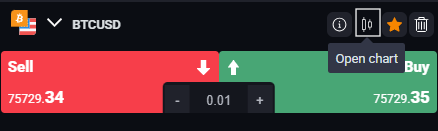
Opening a Chart
To open a chart, click the Open chart button next to the desired asset in the Market module. You may open up to six charts at the same time.
Working with Multiple Charts
When several charts are open, simply click on the chart you wish to interact with — a highlighted frame will indicate which one is active.
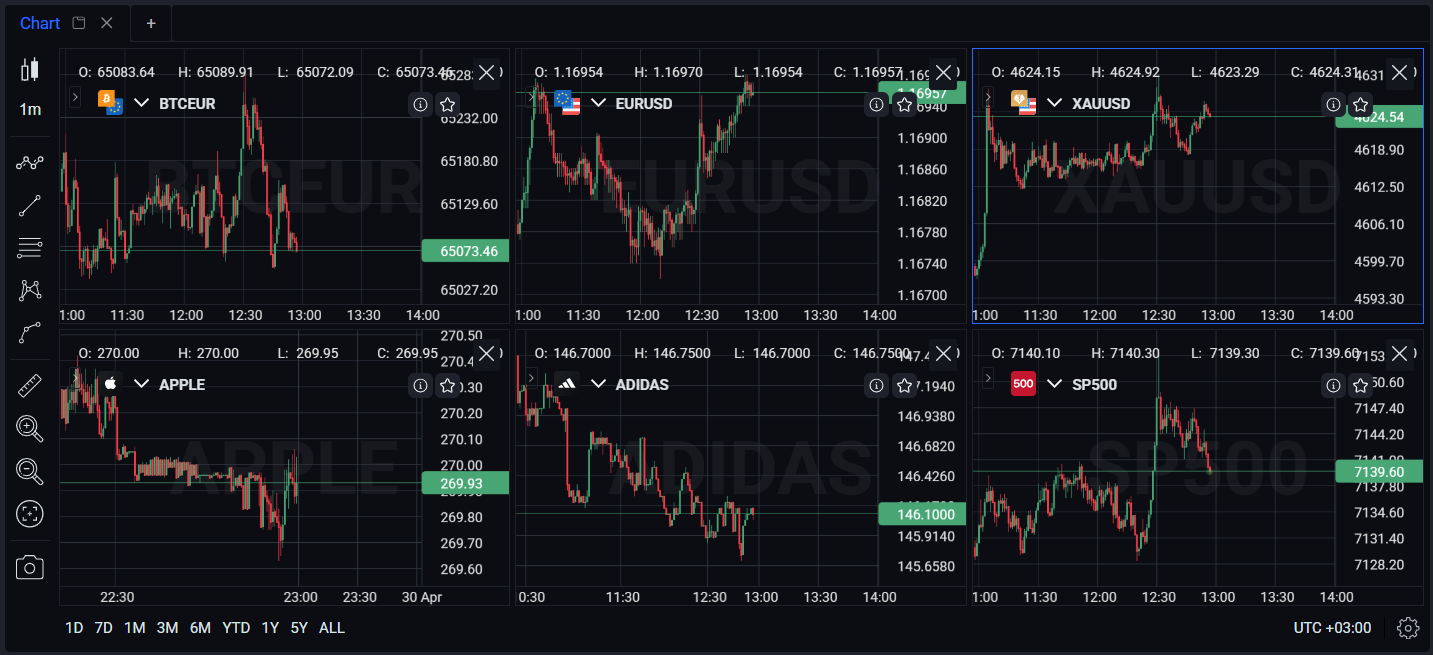
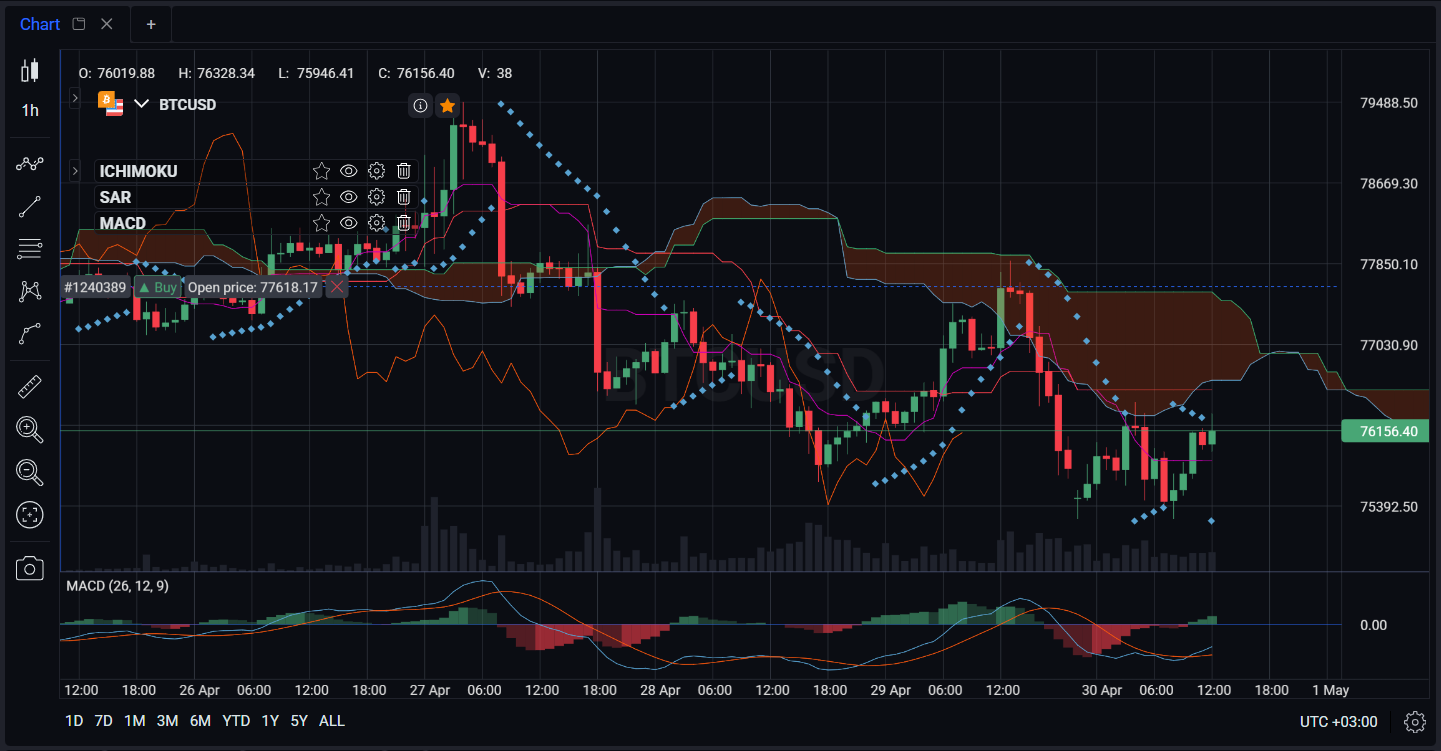
Chart Instruments
The chart module offers a range of tools and data to support your analysis. On the left side of the chart window, you will find the instrument panel, which includes the following options:
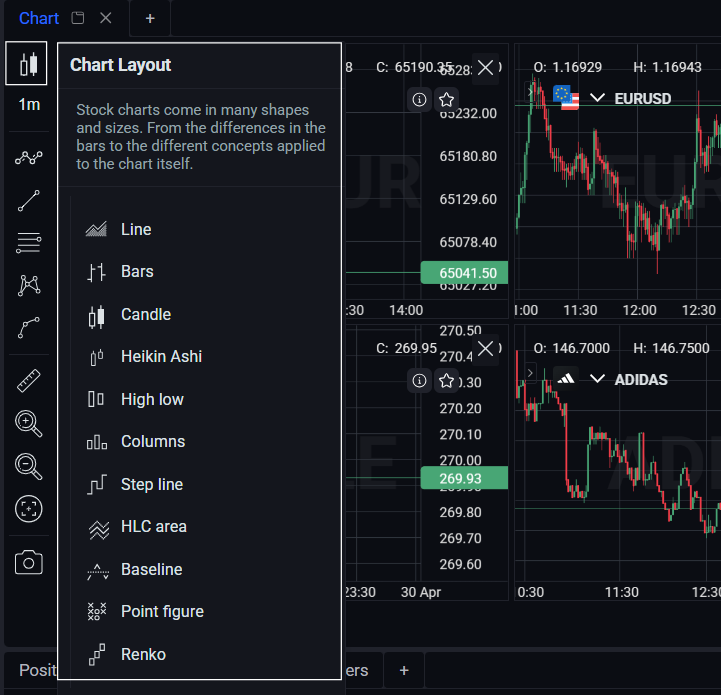
- Chart layout – Choose from different chart styles to view price information.
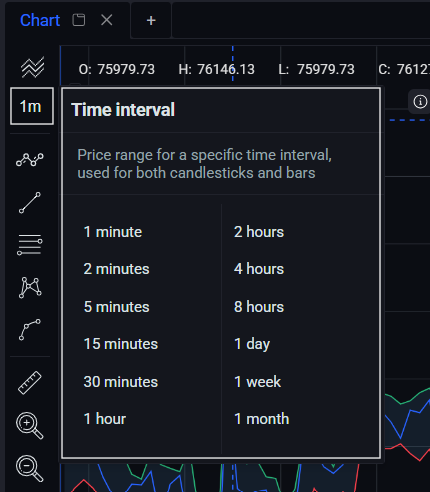
- Time interval -set the duration between each candlestick on the chart. This determines the frequency of the price data displayed and can be customized based on your trading style and strategy.
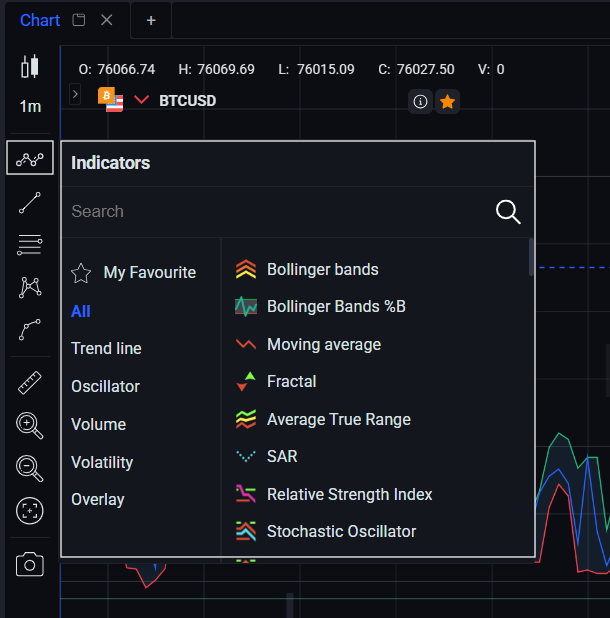
- Indicators- these technical analysis tools help you assess market trends, momentum, and volatility. Use the search box to find a specific indicator or oscillator, or simply scroll through the list. You can also add your favorite tools to the Favourites section for quick access.
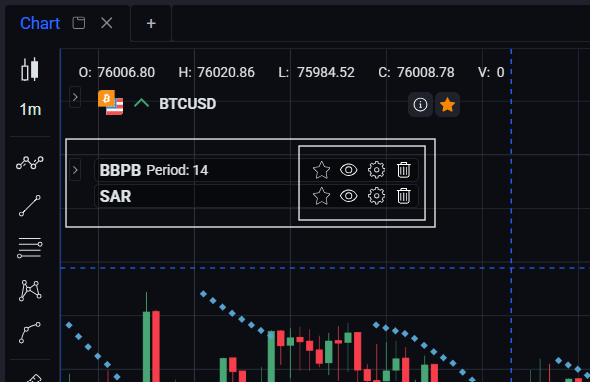
You will see the applied Indicators on the chart. You can add them to the favorites with the star icon, make them visible or not with the eye icon, change their settings (Color, thickness, period, deviation etc depending on the indicator) clicking on the gear icon and delete the indicator from the chart by wastebasket icon.
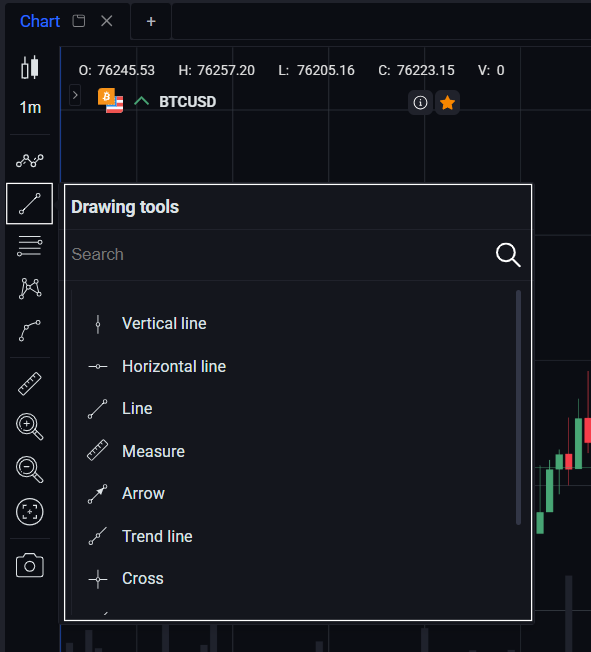
- Linear drawing tools - Draw straight lines on the chart to highlight support and resistance levels, trend lines, and other key points of interest. Use the search box or scroll through the list to find the tool you need.
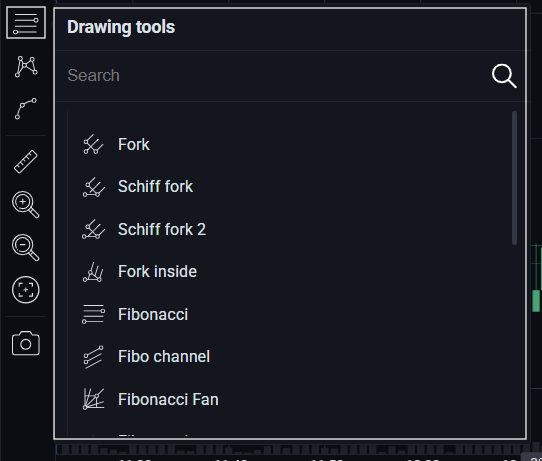
- Fibonacci drawing tools -Draw Fibonacci retracements and extensions based on the mathematical sequence. These tools help identify potential support and resistance levels in the market. Search or scroll to locate the desired tool.
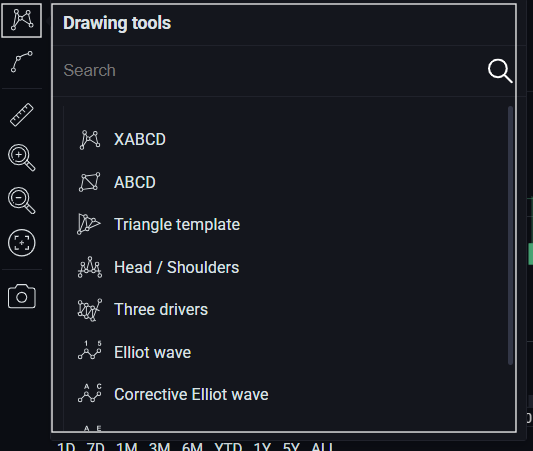
- Poly drawing tools - Create irregular shapes on the chart to mark areas of interest or build custom indicators. Find your tool using the search box or by scrolling through the list.
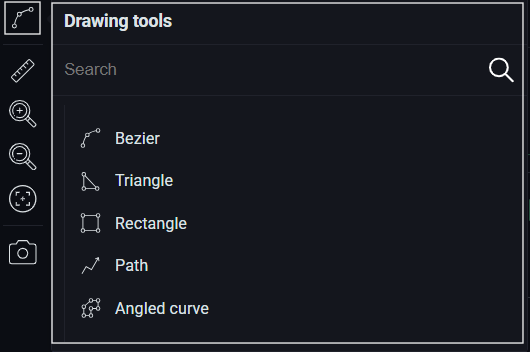
- Geometric drawing tools - Draw geometric shapes — such as triangles, rectangles, and more — directly onto the chart.
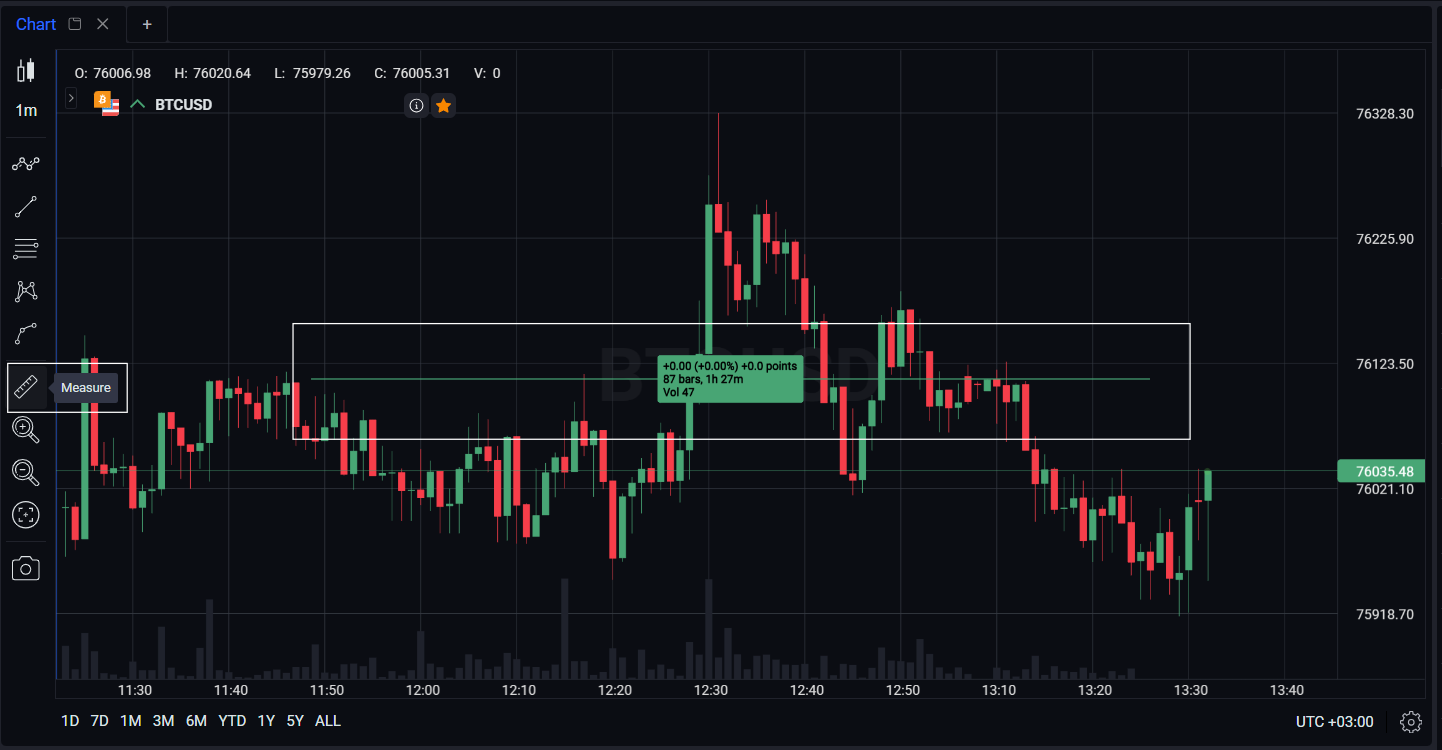
- Measure - The Ruler tool measures the distance between two points on the chart — in pips, percentage, or price units. It helps quickly assess price movement length, target size, or stop-loss distance.
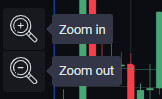
- Zoom in/ zoom out - use the zoom tool to enlarge/reduce the chart size for a more derailed view or wider range of data.
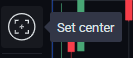
- Set center - easily return to the live trading chart from any point you are viewing. Navigate through chart history and zoom into specific areas of interest, then return to current market conditions with a single click.
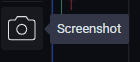
- Screenshot- capture the current chart view and save it as a PNG image file. You can then access and share the screenshot as needed.
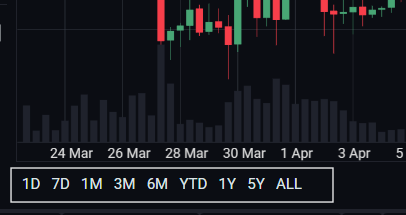
- Time periods- adjust the period of time visible on the chart to suit your analysis needs.
- Additional price information - the indicators O, H, L, CandV correspond to the point where the crosshair is positioned on the chart:
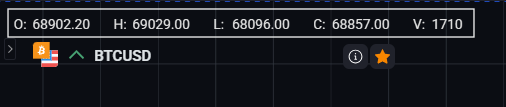
| Indicator | Meaning |
|---|---|
| O (Open) | The opening price of the asset at that specific time |
| H (High) | The highest price the asset reached during that time frame |
| L (Low) | The lowest price the asset reached during that time frame |
| C (Close) | The closing price of the asset at that specific time |
| V (Volume) | The total quantity of the asset traded during that time period |
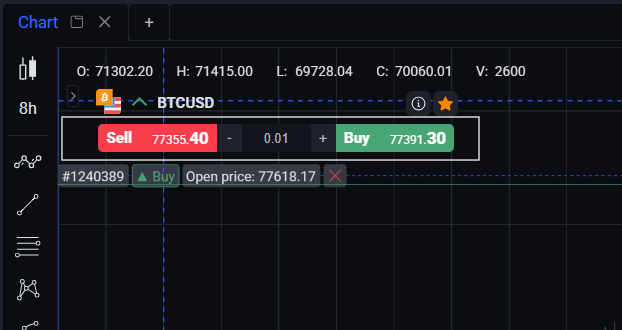
- Quick access trade buttons - trade and perform actions on a specific symbol directly from the chart.
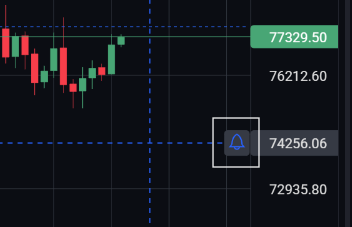
- Quick access Alert button - quickly create an alert for the price level where the crosshair is positioned.
-
Chart quick menu - right-click on the chart to open the quick menu. From here you can:
-
Reset the chart view
-
Show Ask/Bid labels on the chart
-
Add a price alert
-
Open an order
-
Remove indicators
-
Remove drawing tools
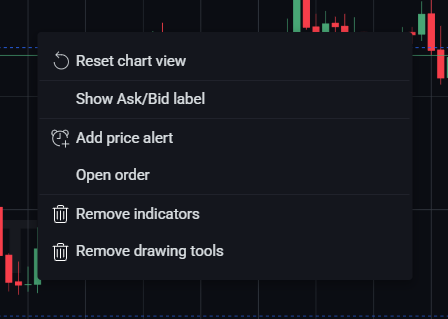
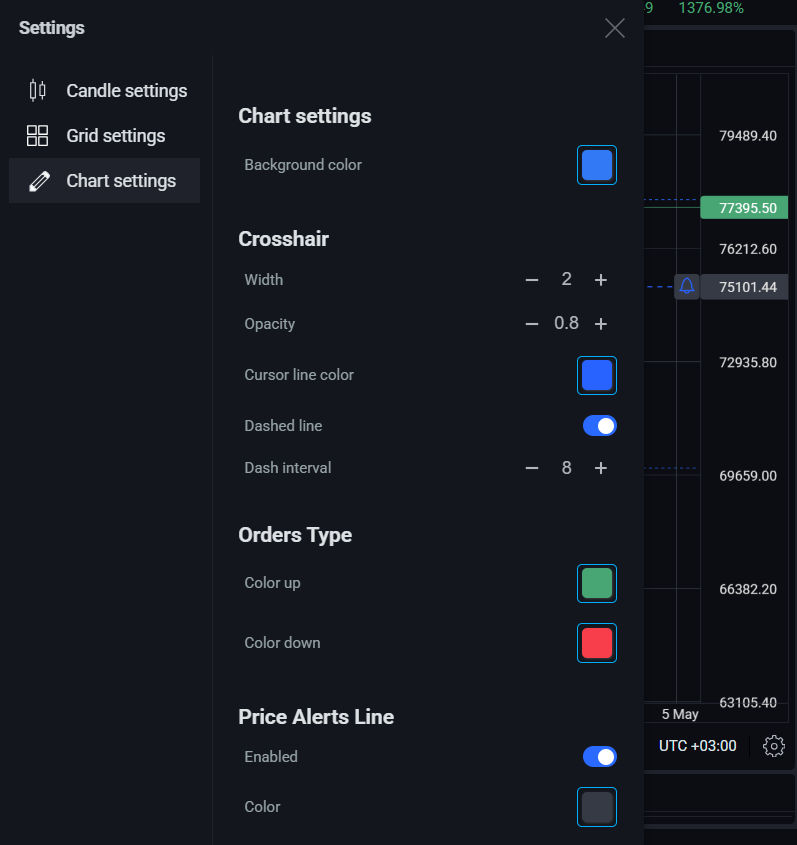
Chart Layout
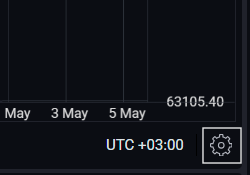
To access chart settings, click the gear icon in the bottom right corner of the chart.
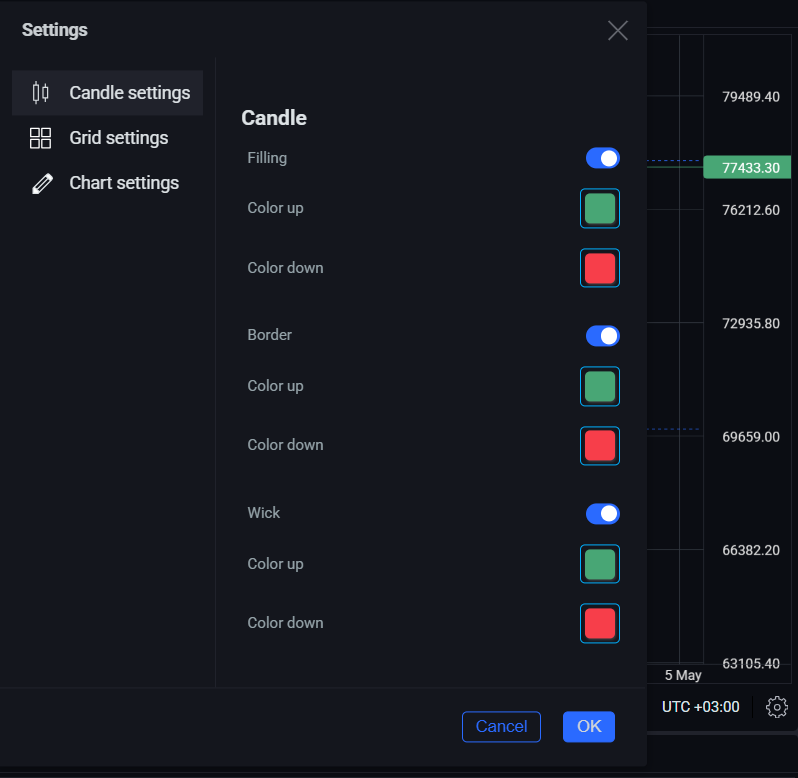
The following options are available:
- Candle settings -configure the appearance of candlesticks. Available options will vary depending on the candlestick type you have selected.
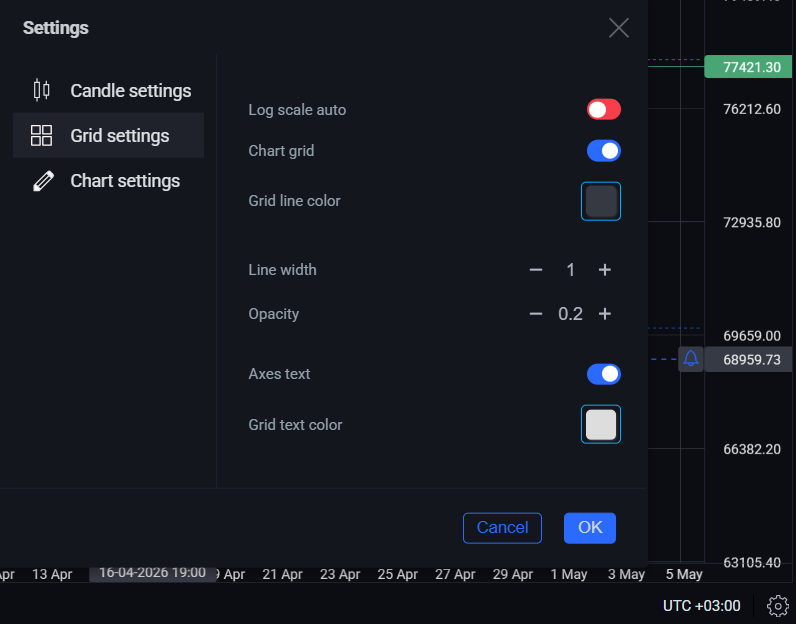
- Grid settings -customize the chart grid and axis text appearance.
- Chart settings - adjust various aspects of the chart itself.